htuovila.github.io
ARPM Bootcamp practice project
I participated in August 2016 in the famous “Advanced Risk and Portfolio Management” (ARPM) bootcamp seminar in New York City led by the creator Attilio Meucci.
To earn a certificate the attendees have to take a two part assignment: a) programming in MATLAB b) pen & paper exam online.
This project contains my submission to the programming assignment.
Deliverables for this assignment can be found here.
and the one-page pdf explaining what was done here.
Introduction
This exercise was done as a coursework for the Advanced Risk and Portfolio Management bootcamp certificate in 2016 in the famous ARPM bootcamp led by Attilio Meucci. [1]
The goal of this exercise was to demonstrate some of the concepts covered in the lectures and in the material, and I decided to study more the idea of panic copulas and flexible probabilities.
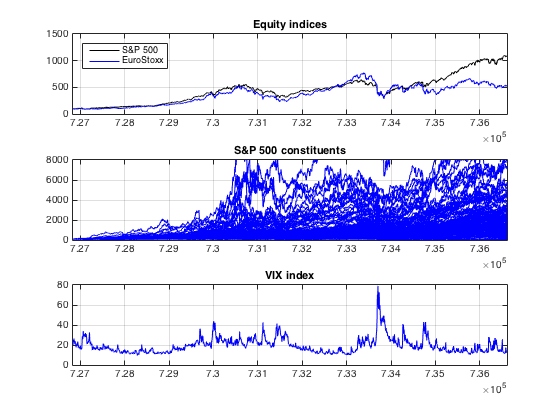
For the study I used the data set most easily available and probably most widely used in similar studies: the S&P 500 index time series and its constituents. The data used can be seen in the figure below.
In the top panel we have the time series of the S&P 500 index, and the EuroStoxx index.
In the mid-panel we have the individual stock prices from S&P 500 indexed to 100 in the beginning of the studied period.
The panel in the bottom contains the time series of the VIX index, which is the volatility index of the S&P 500.
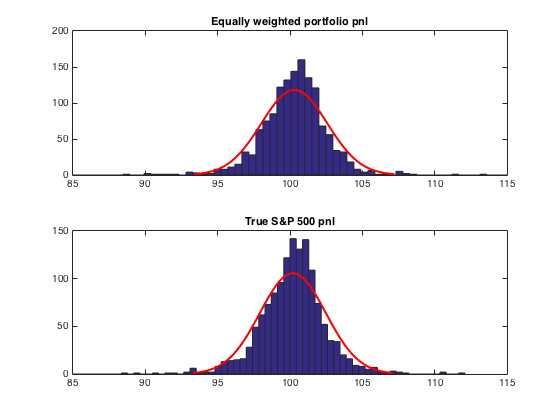
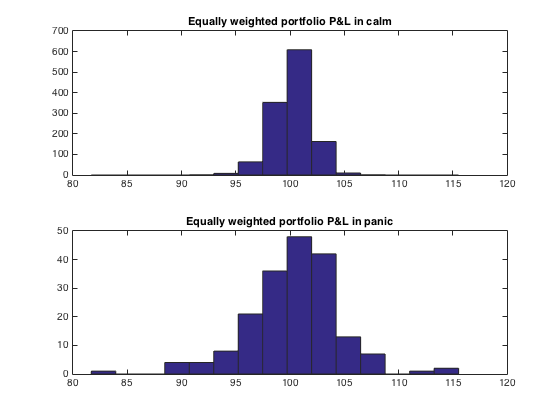
The next two-panel figure shows the true S&P 500 historical returns as a distribution, and the historical returns of a portfolio of individual S&P 500 stocks with equal weights in the portfolio.
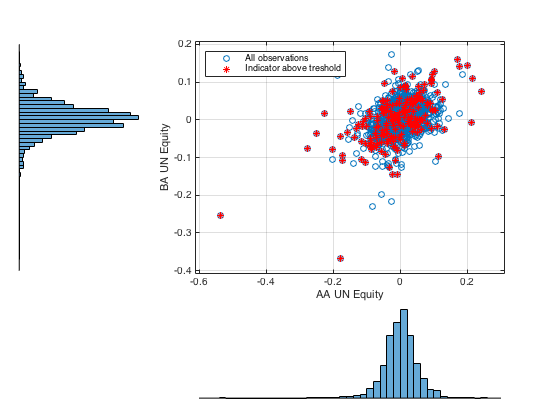
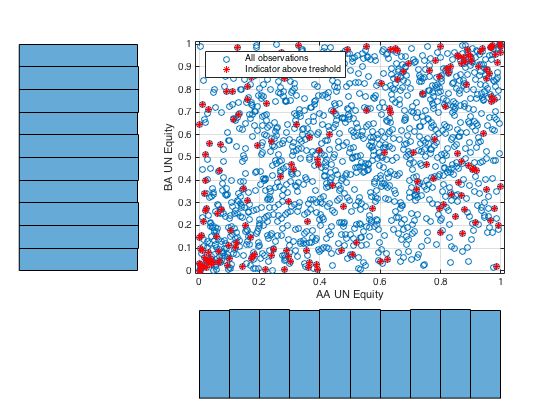
In the next two figures we have the joint distribution of two of the S&P constituents, and the respective copula function.
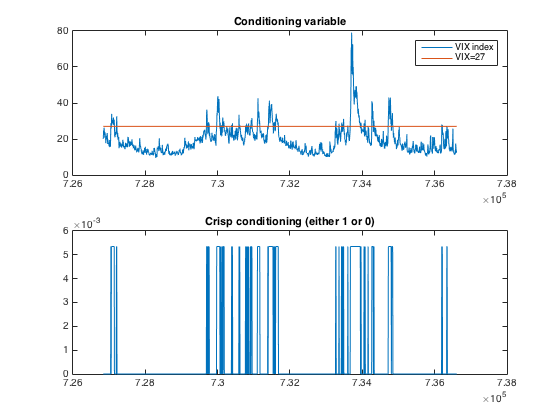
We have set a conditioning treshold for the VIX index at 27 index points, above which we consider the market to be in a state of ‘panic’. The respective ‘panic’ observations are highlighted by red markers. In the latter figure it is easy to argue that indeed, the extreme events occur when the VIX index peaks.
Next we applied a simple conditioning, and separated the observations to two groups: panic and calm markets. Both distributions can be seen in the figure below.
In the next figure we have applied so called ‘crisp’ conditioning to the VIX index, which is identical to the ad-hoc simple conditioning shown above. The probability of the observation is set to 1/N when the conditioning variable is above the treshold and to 0 when below the treshold.
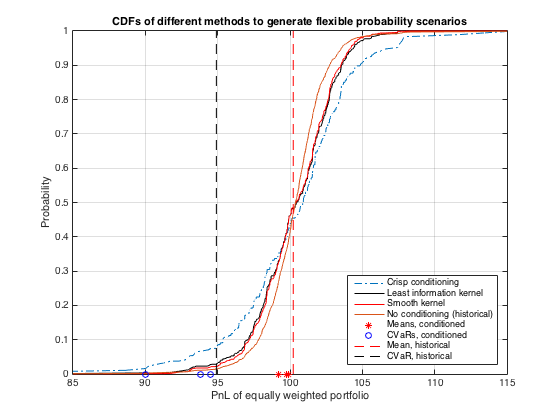
These flexible probabilities allow us to construct distributions for stress testing a portfolio of S&P 500 constituents in different market conditions defined by the conditioning.
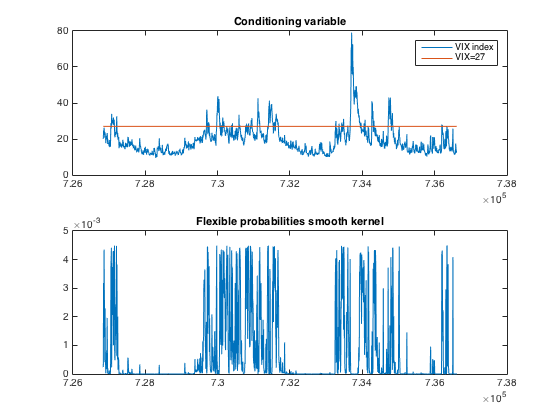
Next we applied a more sophisticated way to come up with the flexible probabilities: smooth gaussian kernel.
The probability of an observation decreases when the conditioning variable decreases, and drops to zero when far enough from the conditioning treshod. This is a neater way to come up with the stress testing distributions, since the selection of an arbitrary panic treshold is not similarly strict.
End notes and conclusions
This practice project was completed to demonstrate having understood some of the topics covered in the ARPM bootcamp seminar in NYC in August 2016.
The results were somewhat surprising: I would have expected to see more extreme correlation shifts, but one reason for less extremes may be the use of weekly data. In the weekly data we might see already some smoothing of the most extreme daily returns due to very quick rebounds.